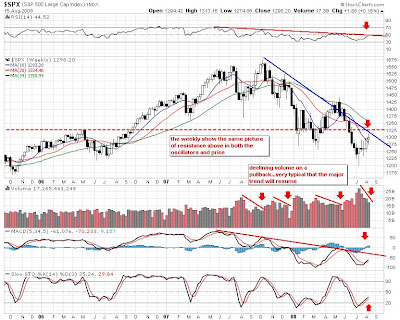
SPX weekly...consistent with the daily as we are right at resistance with declining volume on this entire up leg.

QQQQ was the laggard, first time during this rally. It shows the strength in the resistance zone we are in right now as well as hints that QQQQ might fall hardest once bears rush back in...

QQQQ weekly...like spx weekly, we are at strong resistance here with declining volume...

XLF was the leader today with surprising strength today. But the volume was very low again with bearishness in the oscillators...

XLF weekly...a trend is continuing when looking at the this chart and it favors that we fall from resistance very soon...i think this is the most important chart today...

IWM was down today despite the market being up...intraday resistance at the prior high dropped iwm back down...resistance continues to be the theme

IWM weekly... the resistance near 76 is shown here to be very very strong. Also, it shows that in comparison to other indexes, IWM has the best possibility of breaking out.

MDY weekly is like other charts as well..with declining volume and resistance (though less than some other charts)

UUP daily (1 year)...shows that we will have much trouble breaking this resistance level as it has been a critical point for quite some time now

Dollar / Euro index weekly...as we all know, the dollar is strengthening mainly because the Euro is falling. From this chart, we can see that despite the huge fall in the Euro, it is still in a very strong uptrend and right now is at a good retracement level

USO daily...at good resistance..but also seeming to be finding good support at its levels now. Lets see if it can break out of the downward channel in a relief rally, ruining the rally in the SPX

USO weekly...the daily support level is shown to be a good support level in the weekly as well...

Analysis: Looking at the dozen plus charts that i've attached to this post, you can see just how technical the market has been of late. Volume, price, and moving averages are all agreeing, making for great technical signals. Overall, the consensus is that we are at strong resistance in the daily as well as the weekly charts for the market, dollar, and financials...Support is being found in oil and quite possibly in the euro as well...As we are in a longterm bear trend, i can't help but feel that resistance will not hold and we are heading for atleast a pullback from here....At the moment though, i am in cash with a very small position shorting the financials. Since neither support nor resistance has been broken, we are in a very scary point. I will do my best to stay sidelined until we get a confirmed breakout or breakdown from these levels.
Game Plan: nothing much in terms of buying...I would avoid buying any longs except for maybe a commodity play that has been deeply beaten down by the dollar and is also holding support...As for shorts, keep an eye out for stocks that have either jumped up hard on light volume from this recent rally and is at resistance, or financials that haven't participated much in the rally...
Buy List:
casinos (mgm, lvs, wynn)
consumer related (rost, shld, gm, nflx)
tech not at resistance (rimm, nvda)
bond insurers (abk, mbi)
solars (cy)
NDAQ
CTX
Sell List:
all energy, oil, and gas related
all agriculture and commodity related
stocks at strong resistance (aapl, msft, intc)
financials that didn't rally much lately (leh, mer, ibn, xlf)
CMG
Big Movers List (will make a big move but dunno in which way):
HES
No comments:
Post a Comment